6 minutes | magazine 02/2021
Standing steady in the wind!
Our Liebherr engineers in Biberach, Ehingen and Nenzing have made a large number of new mobile and crawler cranes more stable for use in stormy weather. We are delighted to have therefore won the award in the safety category for our development of special “WindSpeed load charts”.
ESTA Awards of Excellence 2021
The winners of the ESTA Awards of Excellence 2021 were announced on 22 April during an online ceremony. We are delighted to have won the award in the safety category for our development of special “WindSpeed load charts”. These deliver enhanced safety and longer operating times for crane work in windy conditions. The Liebherr engineers in Biberach, Ehingen and Nenzing have made a large number of new mobile and crawler cranes more stable for use in stormy weather.
This development started in the year 2000 for mobile construction cranes with the MK 80 and in 2008 for crawler cranes with the LR 1600/2. Recent LTM models and all cranes in the MK series have also been available with this feature since 2020. The major benefit for our customers is that the cranes are safer, jobs can be planned better and there is less downtime caused by strong winds. That also means increased profitability.

Holger Schilke - Structural Engineer
If the wind speed measured on the crane’s boom during a job exceeds the set chart wind speed, the crane operator can simply switch to a load chart with a higher maximum wind speed which will often allow the job to be continued. Holger Schilke, Structural Engineer at Liebherr in Ehingen explains how jobs can be planned in advance using the new load charts for higher maximum wind speeds.
An excursion into practice
After presenting details of the theory behind the load charts with higher maximum wind speeds in UpLoad 01/2020, we now want to demonstrate their practical use with two actual examples and show the practical benefits for you, our customers. The example we have selected has a genuine link to everyday practice because this is exactly the enquiry made by a customer to our Structural Engineering Department. We were asked to consider a load case with the LTM 1750-9.1 (800t upgrade) in TYV2EN mode:
- Set-up status: T-49.1 (92/92/92) + A-19 + N-28
- Support base: 12 m x 12 m
- Counterweight: 134 t
- Radius: 21 m
- Load: 70.0 t
- Area impacted by the wind including cW value: 68 m2
So what is the maximum wind speed at which this hoist could be carried out?
The first thing to do is to find the ratio of area impacted by the wind (including cW value) to load: Aw/L = 68 m2 / 70.0 t = 0.97 m2/t
Perhaps you will remember that the effective area exposed to the wind in the load chart calculation and as specified in the standard is 1.2 m2/t. Since we are below this value in this case, this means that we do not have to worry about the ratio of area impacted by the wind to load in the rest of the assessment.
So here we go.
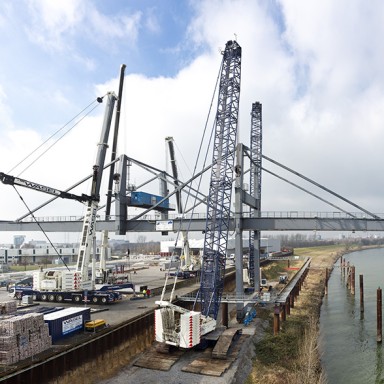
Our WindSpeed load charts enable you to plan jobs better and also work safely in strong wind.
If the lifting capacity for the maximum wind speed of 13.4 m/s had been less than 70.0 t, we would only have been able to carry out the hoist at a maximum wind speed of 11.2 m/s.
This therefore means that if the area impacted by the wind (including cW value) is less than 1.2 m2/t, the maximum possible wind speed can be found quickly and reliably using the existing load charts with no great effort and without losing any time.
But what do you do if the ratio of area impacted by the wind to load is greater than 1.2 m2/t? You may already have guessed that this may take a little more time but is nevertheless not all that complicated.
Let’s stay with our previous example. However, in this case the area impacted by the wind including cW value is now 110 m2 and the load for hoisting is 70.0 t. The ratio is now Aw/L = 110 m2 / 70.0 t = 1.57 m2/t and is therefore above the standard value for calculating lifting capacities. The wind force diagrams, which can be found in any load chart book, now come into play.
So the first thing to do once again is to ensure that the lifting capacity in the wind-dependent load chart is greater than the load which has to be hoisted. Now the load and the corresponding area impacted by the wind must be entered into the relevant diagrams (the table wind speed and the wind speed in the diagram must be identical!). The maximum wind speed is where the two lines intersect. And that’s it!
This shows once again the practical benefit of the additional load chart for use in higher maximum wind speeds because for this load case the maximum wind speed can be increased by almost 50 percent – from 7.9 m/s to 11.7 m/s.
Another point to note is that you will get the same result if you calculate the maximum wind speed using the wind speed calculator in the LICCON work planner – try it for yourself. Load charts with higher maximum wind speeds – a safe haven in stormy weather.
This article was published in the UpLoad magazine 02 | 2021.