Process optimization with LHReportInfo
Liebherr has expanded the range of functions of LHWebPlatform to include an additional tool. The LHReportInfo app visualizes and analyzes the performance of machine tools and generates reports and evaluations from the machine data – a key step toward greater transparency in production.
If information and data from production are in short supply, it is difficult to identify weaknesses and employ the right lever to optimize production processes. A new app on the data platform LHWebPlatform of Liebherr-Verzahntechnik GmbH helps with this. LHReportInfo evaluates the data collected from the machine and provides users with a basis for analysis. With this app, the Kempten firm is expanding the LHWebPlatform to include a tool consisting of pre-prepared reports and diagrams, enabling the machine’s performance to be easily visualized and analyzed.
LHWebPlatform
LHMachineInfo
Live status of machine tools
LHSignalInfo
Visualization of machine signals
LHReportInfo
Analyses and reports
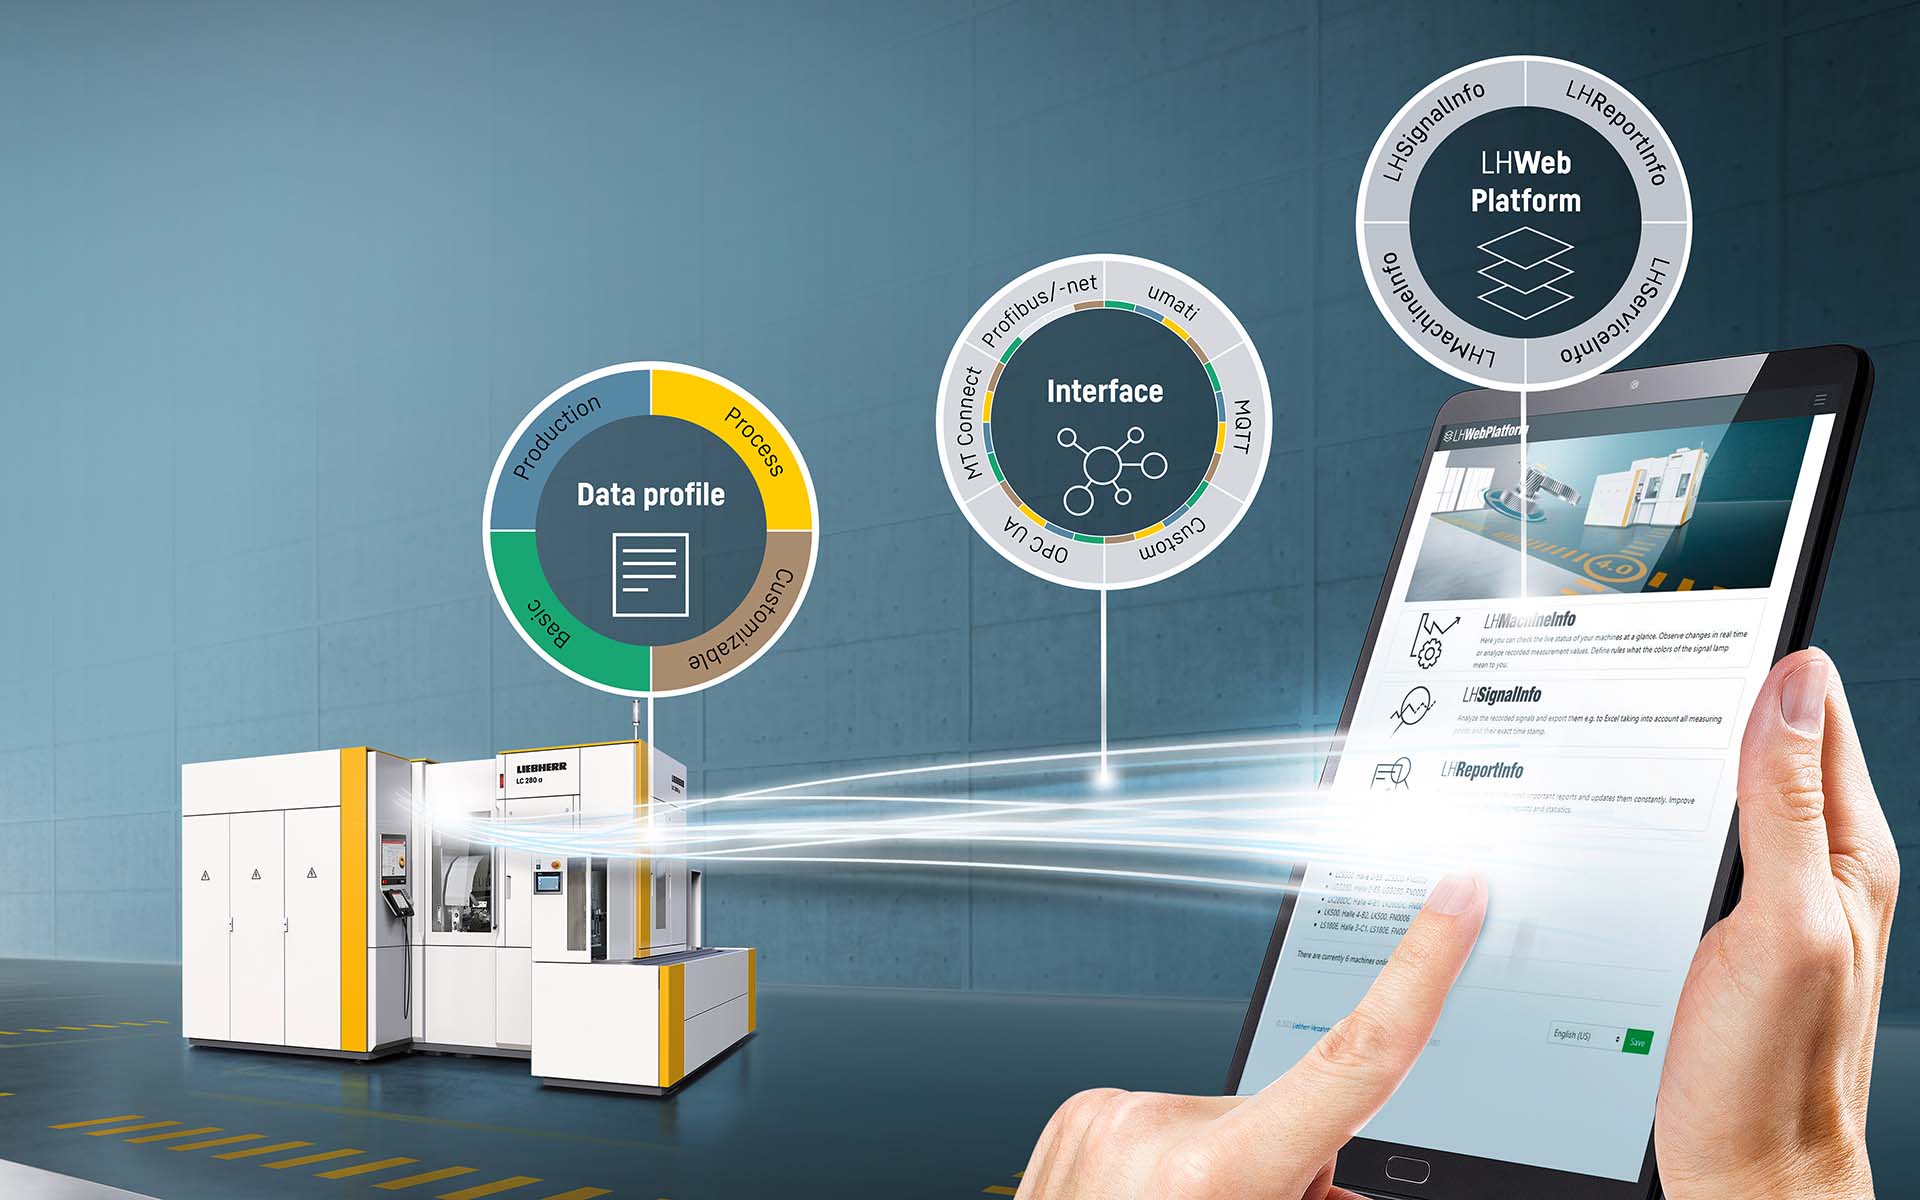
LHWebPlatform – part of the modular digitalization system
With a combination of data profiles, protocols and the LHWebPlatform, Liebherr provides an infrastructure for the acquisition, transmission, storage, processing, provision and display of machine, operating and production data. In the basic app LHMachineInfo, users can see the live status of their machine tools at a glance and observe changes in real time. The LHSignalInfo app visualizes the recorded signals, taking into account all measuring points and their exact time stamp. For example, it is possible to display the temperature behavior of individual axes or of the entire machine graphically and to visualize them in real time.
Transparent machines, clear statistics
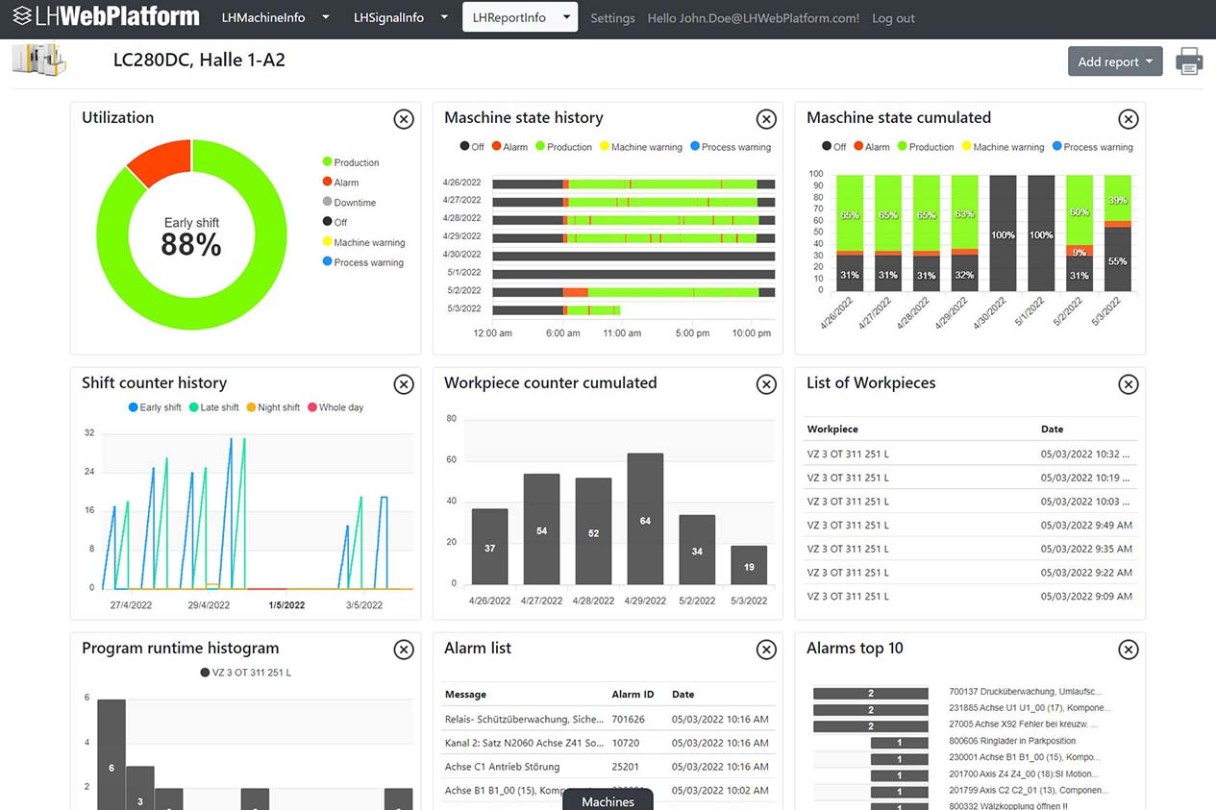
Now a new function has been added. The new LHReportInfo app can evaluate the data collected over a defined period and create reports on various parameters, more or less at the press of a button. From the contents provided with the data profiles, LHReportInfo visualizes and analyzes the performance of the machine and displays the reports and diagrams on a clear, intuitively operated dashboard. Parameters such as machine utilization, reasons for standstills and the most frequent alarms can be called up in just a few steps (see figure below).

Dashboard of LHReportInfo: overview of all eleven reports, updated in real time
Analysis tool LHReportInfo
In combination with the functions of LHMachineInfo, it is now possible to include the entire production chain in the view. “LHReportInfo is a powerful analysis tool that creates transparency for production planning,” explains Florian Schuon, Head of Digital Solutions at Liebherr-Verzahntechnik GmbH. “The special thing about the app is that it also documents organizational reasons for standstills or obstruction, which the operators can select in LHMachineInfo.” This is demonstrated by the following example: The machine is ready for production but cannot continue with the series. The app shows that it has a long wait for evaluation and approval from the measuring room, thus enabling production planning to view possible bottlenecks in other locations, which may be avoidable.
Data-supported production monitoring
The app is easy to install and can also be retrofitted on existing machines. Liebherr offers free test licenses to users who already use the LHWebPlatform. “LHReportInfo offers great potential for economic efficiency with a comparatively small investment,” says Florian Schuon in summary. “The app supports production planning by supplying the basis for data-supported decisions – an essential prerequisite for increasing productivity.”


